
Till recently every geopolitical scare, dollar wobble and equity-market stumble pushed gold higher, taking it to record highs of $5,417 an ounce and ₹1.75 lakh per 10 gm by end-January.
The subsequent correction — about 11 per cent in dollar terms and 14 per cent in rupee terms — has not materially altered the long-term case.
Instead, it offers hesitant investors a more comfortable entry point this Akshaya Tritiya, when many households traditionally buy gold as a symbol of enduring wealth and prosperity.
The macro drivers — monetary debasement, geopolitical instability, fiscal excess, systemic stress and inflation risk — remain intact. For long-term investors, the decline looks more like a pause than a broken trend. While gold bears/equity permabulls would like to remind others of the gold bear market of the 1980s decade, here are four reasons why that fear is far removed from fundamentals.
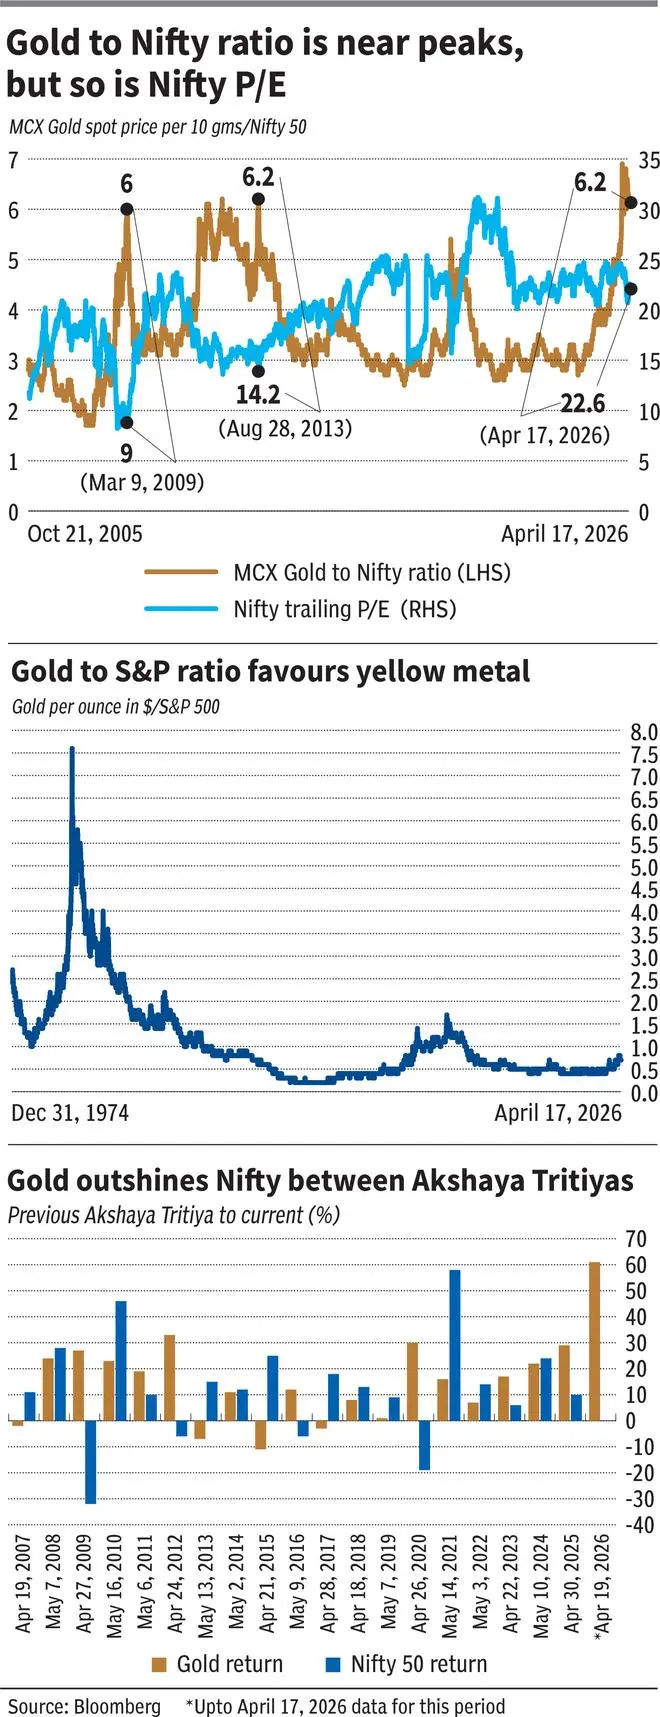
First, the gold-to-S&P 500 ratio — which measures how much of the S&P 500 one ounce of gold can buy — offers a simple gauge of whether bullion is expensive or cheap relative to equities. At about 0.7 today, the ratio suggests gold is strong, but not historically over-owned even though gold prices now at $4,830 appears quite expensive than say $3,300 levels a year ago or $2,400 about two years ago. In the inflation-scarred 1970s, the ratio crossed 2.5 at end-1974, and it exploded to 7.5-7.6 in January 1980 during gold’s great blow-off. Even after that peak, it remained around 3.5-4 in parts of 1981. By contrast, during the post-2000 equity boom and again in the AI-led US stock surge of 2024, the ratio was mostly stuck near 0.4-0.5, showing how dominant equities had become relative to gold.
In relative terms, gold still appears well below the euphoric extremes typical of crisis or inflationary regimes, suggesting room for further outperformance.
Second, gold’s recent decline does not signal that the bull case is broken. From the January 28, 2026 peak of $5,417, the metal fell as much as 19.2 per cent by March 26, before narrowing the drawdown to about 10.8 per cent by April 17. That is sharp, but gold has repeatedly absorbed such setbacks. Even in the recent bull phase, drawdowns of about 5.4 per cent in June 2024 and 7.3 per cent in December 2024 did not derail the uptrend. The historical precedent is even starker: in the mid-1970s, gold slumped from $185 to $104, a drawdown of more than 44 per cent, yet later went on to its 1980 blow-off top. By that standard, the current setback in 2026 looks less like a broken trade and more like a correction within an ongoing cycle.
Context matters
Third, the MCX gold-to-Nifty ratio is elevated — but this time the equity backdrop is very different. In the post-crisis lows of 2009, when the ratio climbed to 6 in March-2009, the Nifty’s trailing P/E was just 9.2 times. That mattered: gold was expensive relative to equities, but equities themselves were plainly cheap and stocks almost doubled in next nine months. Again, in August/September-2013, the ratio hit multi-year high of 6.1 but Nifty P/E was around 14.2 times, a valuation level that helped equities double in the next five years. By contrast, the ratio touched 6.9 on January 29, 2026 with the Nifty still trading at 23.7 times trailing earnings. And by April 17, the ratio was still around 6.2 even with the Nifty P/E on 22.6 times. This suggests gold’s strength is not coinciding with cheap equities, weakening the case for a decisive shift back into stocks. So the current MCX gold-Nifty-ratio at close to peak levels, does not provide any convincing comfort that gold will underperform stocks.
Strong track record
Fourth, history suggests Akshaya Tritiya buyers have little reason to treat gold as a poor cousin to equities. Across 20 comparable one-year holding periods since 2007, gold delivered an average return of 15.9 per cent against 11.8 per cent for the Nifty 50. Gold posted gains in 16 of the 20 periods, marginally better than the Nifty’s 15. More importantly, gold protected capital better in difficult years. Its worst period saw a fall of 11 per cent, against a 32 per cent decline for the Nifty. It outperformed decisively in stress years such as 2009, 2012, 2020 and the latest period (April 30, 2025 to April 17, 2026). Equities still won more often in strong bull phases, but gold’s victories tended to be larger when protection mattered the most. Over the full sample, gold prices rose from ₹9,372 per 10 grams to ₹1,51,097 — a gain of roughly 16 times. Over the same period, the Nifty 50 rose from 3,998 to 24,354, or a little over six times.
allocation mix
Even traditionally balanced investors are turning more constructive on gold. Veteran investor Ray Dalio has recently said a well-diversified portfolio should hold roughly 10-15 per cent in gold, a higher weighting than the 7.5 per cent gold slice in the popularly cited classic All Weather portfolio. He has also argued that gold is unique because, unlike financial assets, it is not someone else’s liability.
Published on April 18, 2026